Climate Risk Map Platform
Enterprise geospatial SaaS frontend for climate risk analysis and decision support

Overview
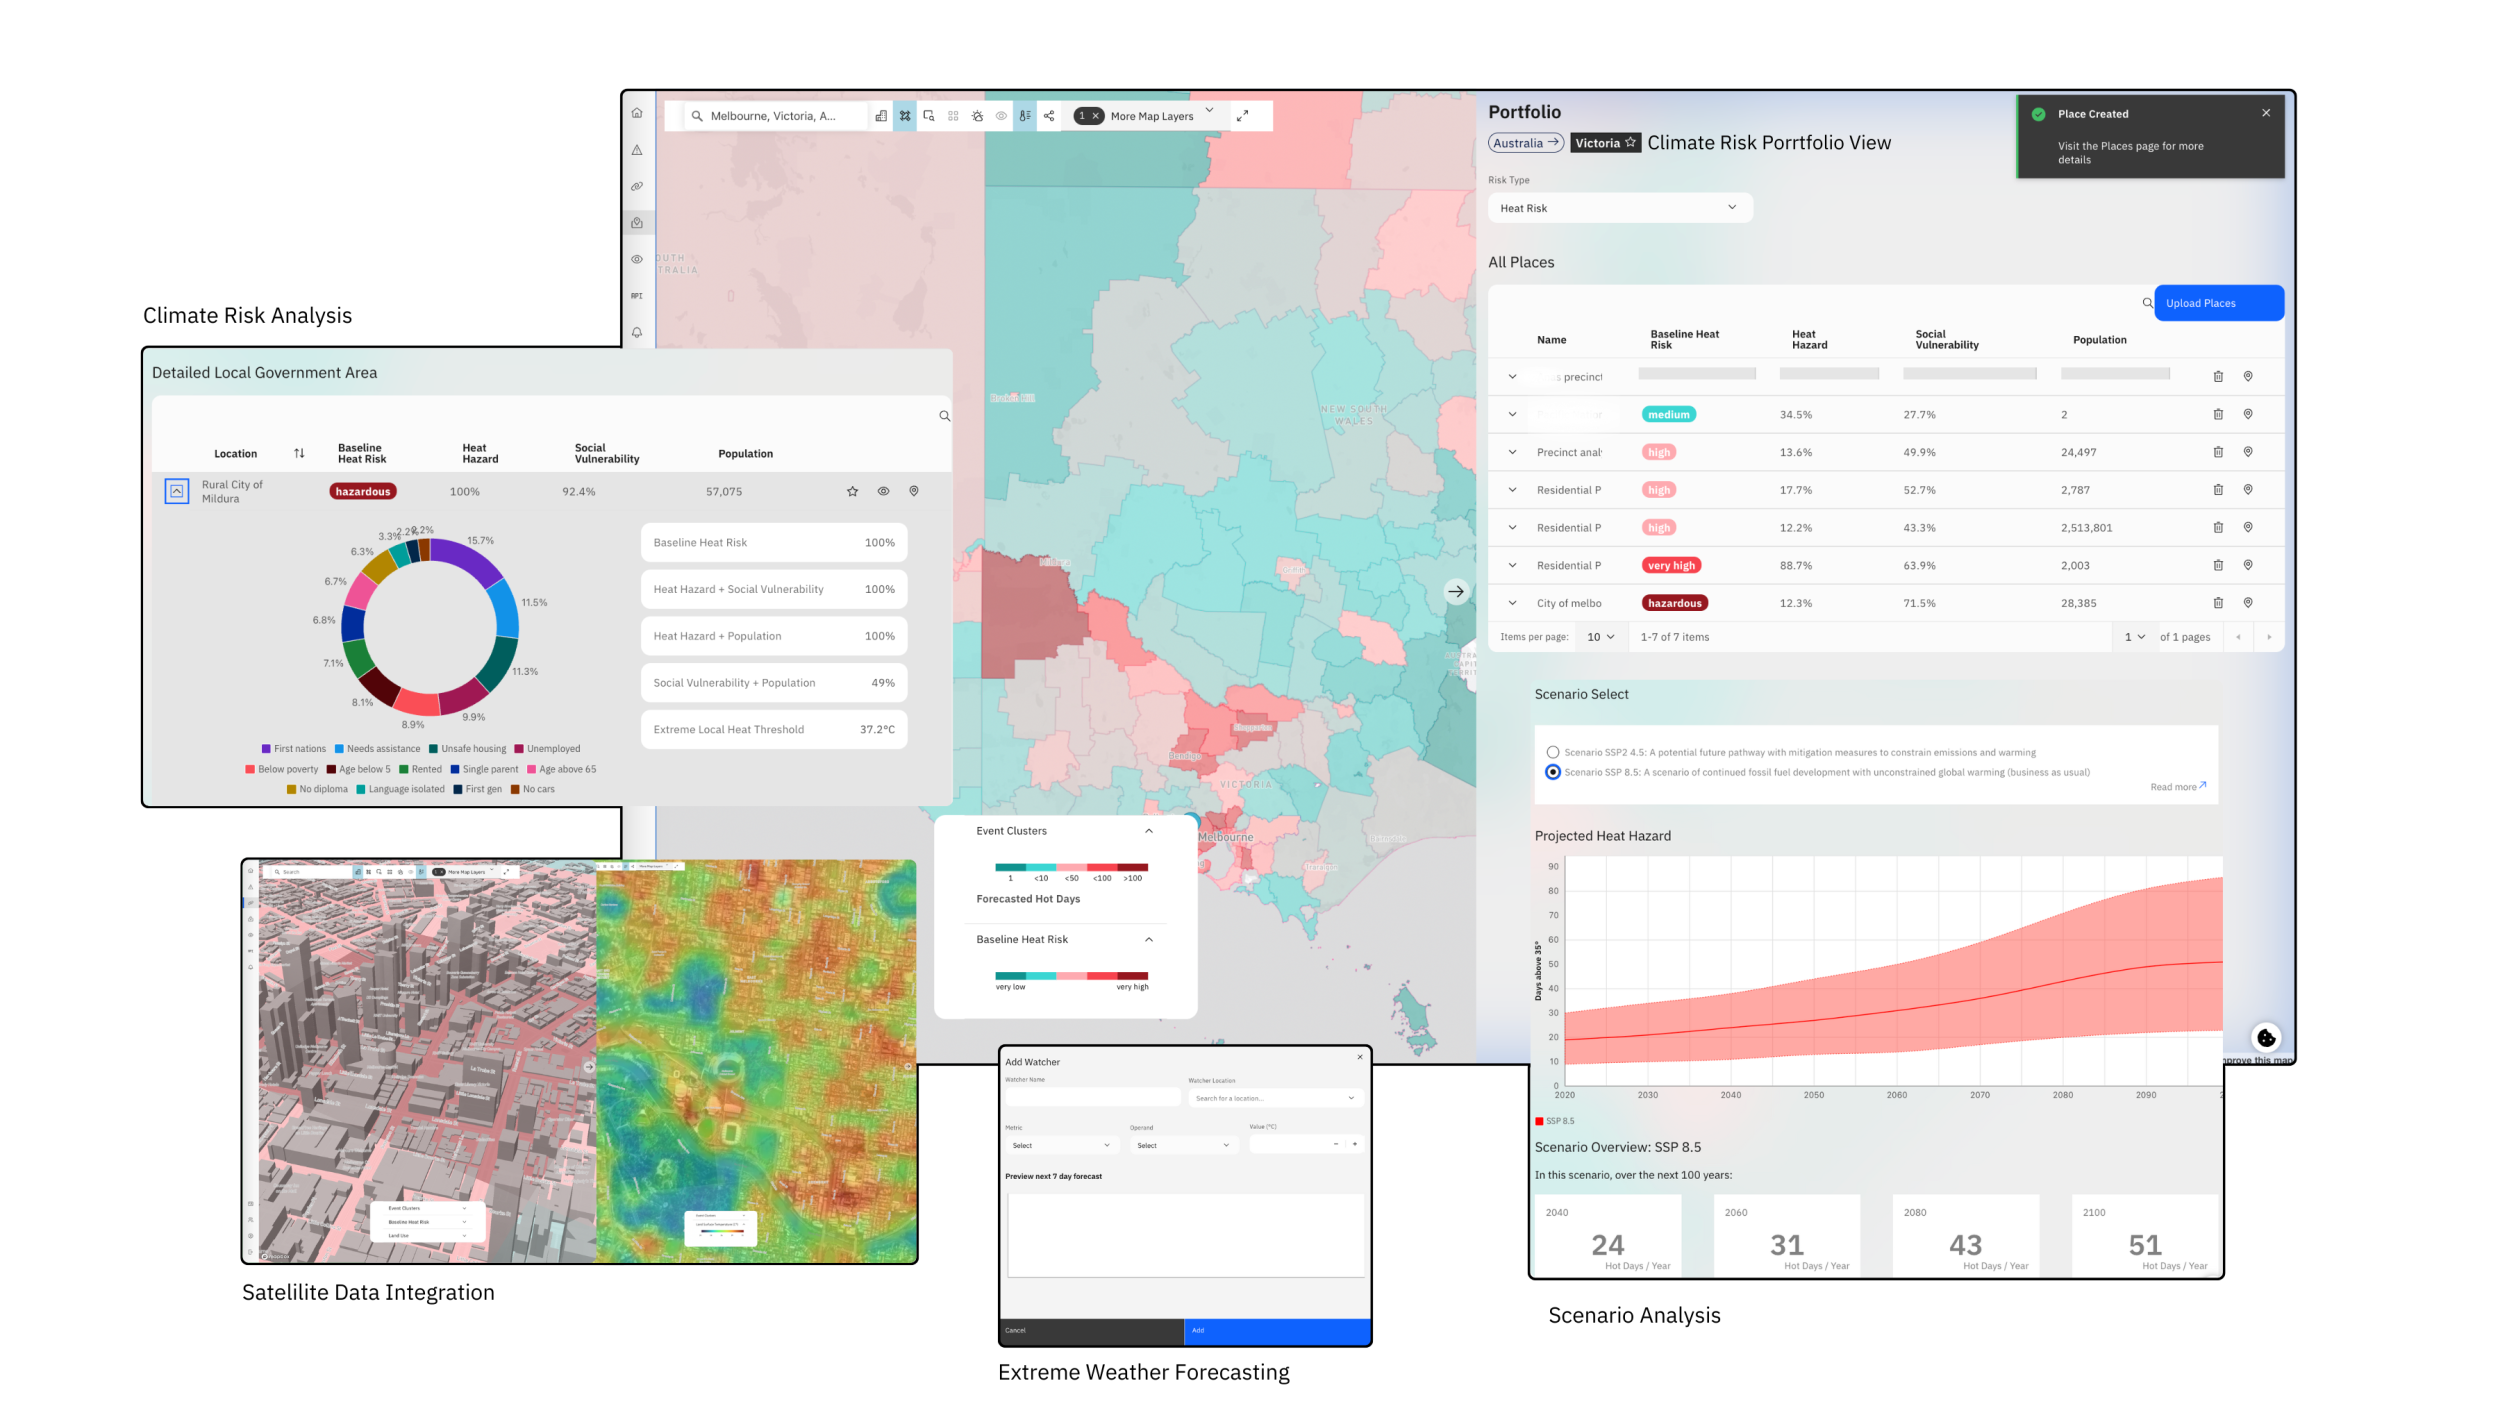
Climasens is an enterprise climate risk platform that helps businesses and governments understand and manage physical climate risk using geospatial data and climate models.
The platform supports multiple hazards, including floods, fire, extreme heat, and wind. It allows users to analyze risk across different time horizons, from short-term events to long-term projections spanning decades.
I lead the frontend of the platform. For over a year, I have been responsible for building and evolving the map experience, data visualization flows, and interactive features in a complex geospatial SaaS product.
My Role
- Lead frontend architecture across map, analytics, and interaction layers
- Develop new features for an evolving enterprise SaaS product
- Maintain and refactor existing components to improve scalability and code quality
- Integrate frontend features with backend risk and analytics APIs
- Manage
Mapbox GL JSlayers for multiple climate hazards - Build dynamic indicators, filters, overlays, and data visualization components
- Optimize performance for map rendering and data-heavy interfaces
- Translate Figma designs into production-ready components using
Nuxt,Vue,Carbon Vue, andTailwind CSS
Problem
The platform needed to present large volumes of climate data in a way that was clear, fast, and interactive.
Users must:
- Explore risk across millions of properties
- Compare multiple hazards
- Switch between scenarios and time horizons
- Interact with data-heavy maps and analytics panels
As the product grew, frontend complexity increased. The challenge was not only adding features, but keeping the system maintainable and responsive as new datasets and capabilities were introduced.
Solution
I evolved the frontend architecture with a focus on modularity, performance, and long-term maintainability.
Key improvements included:
- Separating map logic into clearer modules and composables
- Reducing coupling between hazard configuration, layer rendering, and UI controls
- Standardizing data flow between filters, indicators, map overlays, and API responses
- Refactoring large components into smaller, easier-to-maintain units
- Preserving performance while adding new hazards, projections, and analytics features
This approach allowed the product to grow without sacrificing stability or user experience.
Application Features
Geospatial Hazard Visualization
- Interactive
Mapbox GL JSmaps for flood, fire, heat, and wind risks - Dynamic hazard switching and overlay controls
- Region-aware map behavior across different datasets
Asset-Level Risk Analysis
- Property-level overlays for location-specific risk inspection
- Integration with backend risk scoring APIs
- Context-aware map interactions linked to selected assets
Multi-Horizon & Scenario Exploration
- Short-term and long-term climate projections
- Scenario comparison (e.g., SSP pathways)
- Dynamic legends, indicators, and visual updates
Data-Rich Analytics & Filtering
- Interactive filters for exploring complex risk data
- Risk summary panels and supporting metrics
- Coordinated state across map, panels, and overlays
Alerts & Real-Time Views
- Frontend support for real-time data updates
- Stable UI behavior during asynchronous refresh cycles
Technical Highlights
I refactored large map and analytics components into modular composables and reusable UI patterns. This reduced tight coupling between map rendering and business logic, making it easier to add new hazards, indicators, and features over time.
Frontend Architecture (Nuxt + Vue)
- Composable-based patterns for map behavior and UI state management
- Refactoring large components into smaller, focused units
- Reusable components for filters, panels, and indicator displays
- Clean API integration without mixing UI logic and data-processing logic
Geospatial Rendering & Performance
- Optimized dynamic layer rendering and frequent state updates
- Careful update strategies for overlays, legends, and interactions
- Handling high-density geospatial data while maintaining smooth performance
- Synchronization between map state and analytics panels
Complex State Management
- Coordinated UI state across map controls and projection modes
- Support for multi-scenario climate projections
- Stable handling of asynchronous data updates
- Designed for enterprise workflows involving repeated, data-heavy exploration
What This Project Demonstrates
- Frontend leadership on an enterprise geospatial SaaS platform
- Long-term ownership of a complex production frontend (1+ year)
- Strong
Mapbox GL JSintegration and geospatial engineering - Scalable frontend architecture for data-heavy applications
- Performance optimization for interactive map systems
- Collaboration within a multi-team product environment
- Production implementation of UI/UX designs in a technically complex domain
Impact
This project represents my most advanced frontend work to date. I have led the evolution of a production climate intelligence platform, focusing on scalability, maintainability, and performance. My contributions ensure the frontend can safely grow as new hazards, datasets, and analytics capabilities are added over time.